Welcome to Mode University
Whether you’re just getting started with Mode, want to familiarize yourself with best practices, or are looking to take your workflows and skills to the next level, Mode University has you covered with on-demand courses and videos.

How to Connect a Database
It only takes a few minutes to connect a data source to your Mode Workspace.
Get Started!
Admin

Creating Engaging & Interactive Reports
Consider how others will interpret a Report, and follow these recommendations for creating a compelling and useful resource.
Get Started!
Creating Reports
Analyst
Beginner

How to Create a New Workspace
Create a place for your team to collaborate in Mode.
Get Started!
Video Library
Beginner
Admin

Creating Various Types of Quick Charts
Learn how to create some of the most common types of data visualizations in Mode!
Get Started!
Analyst
Beginner
Business User
Charts & Visualizations
Interactive Course

Optimizing Query Performance with SQL Tuning
Learn best practices for writing optimized queries for efficient data runs in Mode.
Get Started!
Video
SQL
Intermediate
Analyst
Data Engineer
Workflow

Exercise 7: Geo Mapping (Option 2 - JavaScript)
After completing this exercise you will have an understanding of how to use Mode's HTML editor and how to use JavaScript to complement Mode's native visualizations.
Get Started!
Analyst
Notebooks
Charts & Visualizations
Data Engineer
Advanced
Exercise

Using Code-Free Workflows to Get Insights
Take a step farther into using Mode and learn to interact with Report data and create your own visualizations.
Get Started!
Video Library
Intermediate
Business User
New Business User

Formatting Visual Explorer Visualizations
Learn all of the options you have to format your visualization’s axes, pane, legend and header in Visual Explorer.
Get Started!
Video
Visual Explorer
Intermediate
Analyst
Business User
Charts & Visualizations

Creating Pivot Tables in Mode's Visual Explorer
Learn how to build a pivot table from scratch including how to use advanced techniques including conditional formatting, sorting and adding additional measures.
Get Started!
Visual Explorer
Intermediate
Analyst
Beginner
Business User
Charts & Visualizations
Interactive Course

Quick Start Guide to Visual Explorer
Learn about Visual Explorer and how you can use it for in-depth, ad-hoc or self-serve data exploration and visualization.
Get Started!
Visual Explorer
Intermediate
Analyst
Charts & Visualizations
Interactive Course

Applying Custom, On-Brand Colors & Themes to Reports
Learn ways to make your reports pop and help communicate the data narrative through design.
Get Started!
Strategic Accounts
Intermediate
On Demand Webinar
Creating Reports
Analyst
Charts & Visualizations
Admin

Calculated Field Example: Conveying Sentiment Scales or Discrete Categories
See a common application for calculated fields and use the formula on your own data.
Get Started!
Analyst
Calculations

Applying Custom Colors in Visual Explorer
Enter a hex code, use the color selector, and the dropper tool to create custom colors for your visualizations.
Get Started!
Visual Explorer
Creating Reports
Analyst
Beginner
Business User
Charts & Visualizations
Custom Colors
Admin

How to Create Calculated Fields in Reports & Datasets
Learn how to add a calculated field at the Report level or to a Dataset, then use it in a visualization.
Get Started!
Intermediate
Creating Reports
Analyst
Beginner
Calculations

Report Refresh Settings
Adjusting Report refresh settings can help preserve data usage.
Get Started!
Permissions
Data Usage
Admin

Using the Report Builder to Edit Report Layout
Learn how to design your report using Mode's drag & drop report builder to organize and resize your charts, add text, and more.
Get Started!
Video
Creating Reports
Analyst
Beginner
Business User

Table Visualizations
Q&A style recorded session all about using different tables in Mode!
Get Started!
On Demand Webinar
Creating Reports
Analyst
Beginner
Charts & Visualizations
Pivot Tables

Managing Content Permissions with Collections
Collections make it easy to manage who has access to Reports and Datasets.
Get Started!
Permissions
Admin

Applying Custom Sorting Logic to Pivot Tables
Learn how to apply customized sorting logic to your pivot tables for the best representation of the data.
Get Started!
Video
Intermediate
Analyst
Business User
Charts & Visualizations
Data Storytelling
Pivot Tables

Drag & Drop Analytics for Beginners
In this learning path, we’ll show you how to apply your knowledge and data-driven questions in Mode, using visual, drag and drop analysis.
Get Started!
5 Courses
Strategic Accounts
Role-based

Building Self-Serve Infrastructure with Datasets
Learn how Datasets can help you enable self-serve data analytics across your organization.
Get Started!
3 Courses
Datasets
What's new
How to Create a Report from a Dataset
Watch this video to learn how to create a report from a Dataset.
Get Started!
Video
Business User
Workflow
Datasets
What's new

QA Approach to Creating Performant Reports
Gain an understanding of how to create Mode Reports to achieve specific performance goals from a technical, QA approach.
Get Started!
SQL
Creating Reports
Advanced

Exercise 3: Using Table Calculations and Calculated Fields
After completing this exercise you will have an understanding of how to create calculated fields in Mode and apply custom conditional formatting.
Get Started!
Analyst
Custom Colors
Calculations
Exercise

What is Visual Explorer?
Learn how Mode’s new flexible graphing system helps you explore your data quickly, create compelling visualizations and provide easy-to-interpret insights to stakeholders.
Get Started!
Video
Visual Explorer
Intermediate
Analyst
Charts & Visualizations

Big Value & Table Quick Charts
Learn how to build both a Big Value and List Table using Mode's Quick Charts!
Get Started!
Video
Analyst
Beginner
Business User
Charts & Visualizations
Quick Tips & Tricks

Exercise 1: From SQL Query to Simple Report
After completing this exercise you will have an understanding of how to navigate the Mode interface to go from SQL query to a simple report.
Get Started!
SQL
Creating Reports
Charts & Visualizations
Exercise

Choosing a Visualization Environment
Quick Charts or Visual Explorer? Watch this for guidance on where to start visualizing your data!
Get Started!
Visual Explorer
Analyst
Beginner
Business User
Admin

Data Wrangling Certificate Path
Access essential analyst onboarding content. Learn to query data, create Datasets, and use the Notebook in Mode. Complete all the courses and earn a certificate of completion!
Get Started!
5 Courses
Strategic Accounts
Getting Started
Analyst
Role-based

Getting Started with Code-Free Self Service
Essential onboarding courses for anyone who wants to interpret and interact with Reports.
Get Started!
3 Courses
Getting Started
Business Insights
Beginner
Role-based

Getting Started with Calculated Fields
This course will cover how to use calculated fields to improve your workflow, extend your analysis, and get faster insights with your data.
Get Started!
SQL
Intermediate
Analyst
Business User
Interactive Course
Workflow

Familiarizing Yourself with Mode
New to Mode? Start here and prepare to do your best analytics work yet.
Get Started!
Analyst
Beginner
Business User
Admin
New Member
New Admin
New Analyst
New Business User

Creating SQL Snippets Using Definitions
Learn how to use Definitions, which are SQL snippets that allow you to write logic in one place and reference that logic across multiple queries.
Get Started!
Video
Intermediate
Analyst
Beginner
Workflow

Funnel Charts in Visual Explorer
Learn how to create a funnel chart using a calculated field, colors, and data labels.
Get Started!
Visual Explorer
Analyst
Charts & Visualizations
Calculations

Getting Started with AI Assist
Learn how to use AI-generated SQL to complete your queries.
Get Started!
SQL
Analyst
What's new
AI

Organize and Manage Your Mode Reports
Learn to use Collections and My Work to prioritize your reports.
Get Started!
Permissions
Analyst
Beginner
Business User
Organization
Admin

Getting Started with Datasets
Watch this video to learn a few great use cases for Datasets, as well as best practices to follow when creating them.
Get Started!
Video
Datasets

Multivariable Combo Charts in Visual Explorer
Discover how to use Visual Explorer's features to make multi-layered charts.
Get Started!
Visual Explorer
Analyst
Beginner
Charts & Visualizations
Custom Colors

How to Use Colors with Continuous Variables
Find out how to apply custom colors when you're visualizing continuous variables.
Get Started!
Visual Explorer
Creating Reports
Analyst
Beginner
Business User
Charts & Visualizations
Custom Colors
Admin

Creating a Line Chart in Quick Charts
Learn how to create line charts using Mode's Quick Charts in this step-by-step video.
Get Started!
Video
Analyst
Beginner
Business User
Charts & Visualizations
Quick Tips & Tricks

Using Measure Names & Measure Values in Visual Explorer
Learn how you can blend your axes and plot multiple measures in the same pane by using Measure Names and Measure Values.
Get Started!
Video
Visual Explorer
Intermediate
Analyst
Business User
Charts & Visualizations
Explorations

Compare to a Baseline in Visual Explorer
Add a baseline with a calculated field, then add color-coded data points to track performance against the baseline.
Get Started!
Visual Explorer
Analyst
Charts & Visualizations
Calculations

Calculated Field Example: Percent of Total Revenue
See a common application for calculated fields and use the formula on your own data.
Get Started!
Analyst
Calculations

Making Content Discoverable in Mode
Learn best practices to make your workspace Collections, Datasets and Reports easy for users to find in Mode.
Get Started!
Video
Creating Reports
Analyst
Beginner
Admin
Datasets

Using Explorations for Visual Analysis
Learn how to get further business insights and make decisions from your data using Explorations!
Get Started!
Video
Business Insights
Beginner
Business User
Charts & Visualizations
Data Storytelling
Explorations

Creating a Pivot Table Quick Chart
Learn how to create a pivot table and apply conditional formatting in just a few minutes!
Get Started!
Analyst
Beginner
Custom Colors
Pivot Tables

Using Discrete & Continuous Variables in Visual Explorer
Learn why some values are blue and others are green and the difference between discrete and continuous fields in the Visual Explorer.
Get Started!
Video
Visual Explorer
Intermediate
Analyst
Business User
Charts & Visualizations
Explorations

Adding Grand Totals to Pivot Tables
Learn how to add automatic grand totals to your pivot tables using Visual Explorer.
Get Started!
Video
Analyst
Beginner
Business User
Charts & Visualizations
Calculations
Pivot Tables

Understanding Data Fields in Visual Explorer
Start from the beginning with Visual Explorer, and learn about dimensions and measures as data fields.
Get Started!
Video
Visual Explorer
Intermediate
Analyst
Business User
Charts & Visualizations
Explorations

Mode's Python & R Notebook
Mode's Notebook supports advanced analysis in either Python or R. Watch this video to learn more!
Get Started!
Video
Analyst
Notebooks
Advanced

Creating a Pivot Table in Visual Explorer
Learn the basics of building pivot tables in Mode's Visual Explorer!
Get Started!
Video
Analyst
Beginner
Business User
Charts & Visualizations
Pivot Tables

Getting Started with the SQL Editor
Learn how to access your connected databases and browse tables using the schema editor.
Get Started!
SQL
Analyst
Beginner

How to Clone Sample Mode Reports
Learn how to clone sample Mode reports into your own workspace so you can practice and follow along with examples.
Get Started!
Video
Creating Reports
Analyst
Beginner
Business User

Using Layers for Multi-Dimensional Data in Visual Explorer
Mode’s Visual Explorer has several layer options that allow you to communicate the multi-dimensionality of your data visually.
Get Started!
On Demand Webinar
Analyst
Business User
Charts & Visualizations
Custom Colors

Calculated Field Example: Rolling 7-Day Revenue Average
See a common application for calculated fields and use the formula on your own data.
Get Started!
Analyst
Calculations

Use Cases for Datasets
Check out this video to learn great use cases and scenarios for building Datasets.
Get Started!
Video
Analyst
Admin
Datasets
Quick Tips & Tricks

Best Practices for Getting Insights from Reports
This video covers best practices for using Mode's interactive features to get more insights from your reports.
Get Started!
Video
Business Insights
Analyst
Beginner
Business User

Calculated Field Example: Cumulative Sum of Revenue
See a common application for calculated fields and use the formula on your own data.
Get Started!
Analyst
Calculations

How to Use Colors with Discrete Variables
Discover which types of custom colors you can use when visualizing discrete variables.
Get Started!
Visual Explorer
Creating Reports
Analyst
Beginner
Business User
Charts & Visualizations
Custom Colors
Admin

Advanced Pivot Table Techniques
Learn how to apply advanced techniques to your pivot tables to make the data as easy-to-interpret as possible.
Get Started!
Video
Analyst
Charts & Visualizations
Advanced
Data Storytelling
Pivot Tables

Creating a Bar Chart in Quick Charts
Learn how to build a bar chart using Mode's Quick Charts in this step-by-step video.
Get Started!
Video
Analyst
Beginner
Business User
Charts & Visualizations
Quick Tips & Tricks

Dataset Scheduling Best Practices
Learn best practices for scheduling Datasets so that all the child reports have access to fresh data.
Get Started!
Video
Creating Reports
Analyst
Organization
Admin
Datasets

Changing a Report's Timeframe View
Learn how to change the granularity of the charts in a report you're viewing to drilldown into specific timeframes.
Get Started!
Video
Business Insights
Creating Reports
Analyst
Beginner
Business User
Charts & Visualizations

Self-Serve Business Insights
Q&A style recorded session to help improve your self-serve workflows in Mode.
Get Started!
Business Insights
On Demand Webinar
Analyst
Beginner
Business User
Workflow
Data Storytelling

Applying Conditional Formatting to Pivot Tables
Learn how to apply conditional formatting logic to your pivot tables in Mode.
Get Started!
Video
Intermediate
Analyst
Charts & Visualizations
Pivot Tables

Using Measure Names & Measure Values in Pivot Tables
Learn how to extend the flexibility of your pivot tables by using the Measure Names and Measure Values fields.
Get Started!
Video
Analyst
Charts & Visualizations
Advanced
Pivot Tables

Data Usage & Workspace Stats
Q&A style recorded session to help improve your workflows in Mode.
Get Started!
Office Hours
Data Usage
On Demand Webinar
Advanced
Admin

What is a Workspace?
Learn about one of the fundamentals of using Mode.
Get Started!
Analyst
Beginner
Business User
Admin

Mode's Collections
Learn how you can organize content in Mode.
Get Started!
Analyst
Beginner
Business User
Admin

Creating a Histogram in Quick Charts
Learn how to build a histogram using Mode's Quick Charts in this step-by-step video.
Get Started!
Analyst
Beginner
Charts & Visualizations
What's new

Managing Sharing Settings
Learn how to adjust sharing settings for your Workspace.
Get Started!
Admin

Adding Custom Color Palettes to Mode
Learn how to create new color palettes to use in your visualizations, and make them available for your team.
Get Started!
Video
Analyst
Charts & Visualizations
Custom Colors
Admin

Building a Visualization with Visual Explorer
Watch how quickly and easily a simple visualization is built from scratch in Visual Explorer.
Get Started!
Video
Visual Explorer
Intermediate
Analyst
Business User
Charts & Visualizations

Exploring Reports with Drill Anywhere
Discover how to drill-down anywhere in a report to explore data on your own.
Get Started!
Analyst
Beginner
Business User
What's new
New Business User

Exercise 2: Simple Visual Explorer Chart and Custom Colors
After completing this exercise you will have an understanding of how to use Mode's Visual Explorer to create simple visualizations.
Get Started!
Visual Explorer
Charts & Visualizations
Custom Colors
Exercise

Exercise: Use AI Assist to Complete SQL Queries
In this exercise, you'll add natural language to existing SQL code. Then, you’ll implement AI-generated code to complete and successfully run queries.
Get Started!
SQL
Analyst
Data Engineer
What's new
Exercise
AI

Exercise 10: Creating & Using a Dataset
After completing this exercise you will have an understanding of how to create a new Dataset in Mode, and how to use a Dataset for a no-code report creation process.
Get Started!
Analyst
Business User
Datasets
Exercise

Exercise 4: Creating Hypotheses Through Visual Analytics
After completing this exercise you will have an understanding of how to use Mode's visualization environment to create hypotheses and gain deeper insights.
Get Started!
Visual Explorer
Charts & Visualizations
Data Storytelling
Exercise
Filters

Exercise 5: Predictive Analytics Using Python
After completing this exercise you will have an understanding of how to use Mode's integrating notebook to perform Python-based analytics.
Get Started!
Analyst
Notebooks
Charts & Visualizations
Data Engineer
Advanced
Exercise

How to Copy & Paste Visualizations From One Report to Another
Watch this quick tips & tricks video to learn how to copy visualizations from one Mode Report to another.
Get Started!
Charts & Visualizations
Explorations
Quick Tips & Tricks

Applying Custom Colors in Quick Charts
Bring your tables and charts to life with unique colors!
Get Started!
Visual Explorer
Creating Reports
Analyst
Beginner
Business User
Charts & Visualizations
Custom Colors
Admin

Orienting Yourself to a Mode Report
Learn how to get the most out of the data by understanding its context and origin.
Get Started!
Video
Business Insights
Analyst
Beginner
Business User

Adding Nested Navigation Tabs to a Report
Learn how to add interactive, nested navigation tabs in your Report with HTML.
Get Started!
Intermediate
Creating Reports
Analyst
Advanced
Quick Tips & Tricks
HTML

Mode + Looker Open SQL
If you use Looker, you can connect it to Mode and query your Looker Explores or Views as a data source.
Get Started!
SQL
Intermediate
Analyst
Advanced
Quick Tips & Tricks

Creating Quick Calculations in Visual Explorer
Learn how to use pre-built calculations you can apply to the data in your visualization in this recorded webinar.
Get Started!
Video
Intermediate
On Demand Webinar
Analyst
Business User
Charts & Visualizations
Calculations
Pivot Tables

Exercise 9: Adding Filters, Text and Formatting a Report
After completing this exercise you will have an understanding of how to apply Report filters, add text and format a Report.
Get Started!
Business Insights
Creating Reports
Analyst
Business User
Explorations
Filters

Data-Driven Storytelling with Visual Explorer
Learn ways to share the narrative of the data using Mode's Visual Explorer in this on-demand webinar.
Get Started!
Intermediate
On Demand Webinar
Analyst
Charts & Visualizations
Data Storytelling

The Visual Explorer Landscape
This on-demand webinar is designed to help you gain a solid understanding of what Visual Explorer is and how it works.
Get Started!
On Demand Webinar
Analyst
Beginner
Charts & Visualizations
Data Storytelling

Launching Datasets to Your Organization
Learn how to plan a successful Datasets launch to your teams, including stakeholder enablement and how to keep Datasets updated over time.
Get Started!
Analyst
Admin
Datasets
What's new

Time Over Time Queries
Make sure your time over time query includes time ranges that actually have data in them.
Get Started!
SQL
Intermediate
Analyst
Beginner

How to Update or Delete Collections
Learn how to edit and delete existing Collections in your Workspace.
Get Started!
Organization
Admin

Setting and Restricting Sign-In Methods
Learn how to enable or disable sign-in methods for your teammates in Mode.
Get Started!
Admin

SQL Editor Tips & Tricks
Discover ways to accelerate your SQL workflows using Mode's editor.
Get Started!
Video
SQL
Intermediate
Creating Reports
Analyst

Enabling Self-Serve with Datasets
Learn strategies and practical tips for enabling self-serve in Mode using Datasets in this recorded webinar.
Get Started!
Video
On Demand Webinar
Analyst
Admin
Datasets
What's new

Custom SAML Options
Learn how to set up SAML authentication for your Workspace.
Get Started!
Admin

Columns & Rows in Visual Explorer
Learn how to use columns and rows to build visualizations with your data fields.
Get Started!
Video
Visual Explorer
Intermediate
Analyst
Business User
Charts & Visualizations
Explorations

Managing Workspace Members
Learn how to invite new members to your Workspace, and how to manage existing members.
Get Started!
Admin

Using Custom Colors in Mode
Color is an important tool for communicating insights through data visualizations, and it's great to stay on-brand, too!
Get Started!
Intermediate
Analyst
Business User
Charts & Visualizations
Custom Colors
Interactive Course
Admin
What's new

Best Practices for Using SCIM
Discover how to implement SCIM for your Workspace.
Get Started!
Admin

Permissions for Workspace Actions
Learn how to adjust who can invite members, connect databases, and other key actions in your Workspace.
Get Started!
Admin

Using Parameters & Filters in Reports
Learn the differences between parameters and filters and how both can be helpful for creating reports your teammates can slice and dice themselves.
Get Started!
Video
Strategic Accounts
Business Insights
Analyst
Business User
Data Storytelling

Two Approaches to Permissioning in Mode
Structure access levels for your teammates based on how they'll collaborate in Mode.
Get Started!
Permissions
Admin

Adding Filters and Parameters to Reports
Determine when and how to add filters and parameters to maximize a Report’s impact.
Get Started!
Data Usage
Creating Reports
Analyst
Business User

Parameter Use Cases
Parameters are a powerful way to slice data in a Report, and they play a crucial role when Report filters don't suffice.
Get Started!
SQL
Intermediate
Creating Reports
Analyst
Adding & Applying Filters in Reports
If you're creating a Report, consider adding filters with just a few clicks so that viewers can slice the data on their own.
Get Started!
Creating Reports
Analyst
Beginner
Business User

How to Set Up Groups to Manage Permissions
Use groups to manage who has access to what in your Workspace.
Get Started!
Permissions
Admin

How to Manage Data Connection Permissions
Learn how and where to adjust your teammates' access to connected databases.
Get Started!
Admin

Organizing Content in Collections
Learn how to add, move, or remove content in Collections.
Get Started!
Organization
Admin

Create a Collections Organization Strategy
Structure Collections in your Workspace in a way that facilitates stronger collaboration on your team.
Get Started!
Organization
Admin

Getting Insights from Mode Reports
Take this course to find out how Mode can help you leverage data to make data-driven business decisions!
Get Started!
Business Insights
Analyst
Beginner
Interactive Course
Workflow

What are Calculated Fields?
Learn about calculated fields, including what they can do and why and when to use them in Mode.
Get Started!
Video
Intermediate
Analyst
Business User
Calculations

Using the Notebook for Python & R Analysis
Get to know Mode’s Notebook environment so that you can execute advanced analysis on top of query results.
Get Started!
Intermediate
Analyst
Notebooks
Beginner
Data Engineer

Embedding Reports
Learn about embedding options for Reports.
Get Started!
Admin

What's Possible in Visual Explorer
Catch a glimpse of what you can create in Visual Explorer!
Get Started!
Visual Explorer
Analyst
Beginner
Business User
Admin

Workspace Settings
Learn where and how to adjust key settings for your team in Mode.
Get Started!
Beginner
Admin

Using the Discovery Database to Understand Data Compute
Learn how to leverage the Discovery Database to monitor data usage.
Get Started!
Data Usage
Admin

How to Create a Dataset
Watch this video to learn how to build a new Dataset.
Get Started!
Video
Video Library
Datasets
What's new

Exercise 6: Geo Mapping (Option 1 - Python)
After completing this exercise you will have an understanding of how to use libraries in Python to create visualizations to complement Mode's native capabilities.
Get Started!
Analyst
Notebooks
Charts & Visualizations
Data Engineer
Advanced
Exercise

Exercise 8: Adding a Report Parameter and Creating a Gauge Visualization
After completing this exercise you will have an understanding of how to add parameters to a report.
Get Started!
Analyst
Notebooks
Data Engineer
Advanced
Exercise

Quickstart: Getting Started with Mode
This series of hands-on exercises is perfect for learning how to get started with Mode quickly. Great for analysts and data-savvy business users alike.
Get Started!
10 Exercises
Visual Explorer
Getting Started
Creating Reports
Notebooks
Charts & Visualizations
Custom Colors
Data Storytelling
Calculations
Pivot Tables
HTML

Adding Quick Calculations to Pivot Tables
Learn how to use Mode's quick calculations including percent difference, difference, and percent of total with pivot tables.
Get Started!
Video
Intermediate
Analyst
Charts & Visualizations
Calculations
Pivot Tables

Querying Data in Mode
Leverage Mode’s powerful SQL editor to query your data sources.
Get Started!
SQL
Analyst
Data Engineer

Ways to Build BI Content in Mode
The type of BI content you build depends on what you need it to accomplish. Learn how to build multiple types of BI content in Mode.
Get Started!
Analyst
Beginner
Admin

Ways to Build BI Content in Mode
Mode offers multiple ways to build BI content to drive your business forward.
Get Started!
Creating Reports
Analyst
Beginner

Report Styling & Presentation
Create Reports that effectively convey information in a clear and compelling way.
Get Started!
Creating Reports
Analyst
Beginner
Business User
Data Storytelling

Mode's Visualization Environments
Discover Quick Charts and Visual Explorer, and determine where to start building your visualizations.
Get Started!
Visual Explorer
Analyst
Beginner
Charts & Visualizations

Visual Storytelling with Data Certificate Path
Discover how to create powerful visualizations and present them in engaging Reports in Mode. Complete all the courses and earn a certificate of completion!
Get Started!
7 Courses
Getting Started
Analyst
Role-based

Using Visual Explorer to Create Dynamic Visualizations
Leverage Visual Explorer’s features to easily add depth and clarity to your visualizations.
Get Started!
Visual Explorer
Intermediate
Analyst
Beginner
Charts & Visualizations
Custom Colors
Advanced
Calculations

Using Table Calculations in Quick Charts
Learn how to apply table calculations like Percent Difference, Difference and Percent of Total to your Quick Charts.
Get Started!
Calculations
Quick Tips & Tricks

First Steps with Mode
Hit the ground running with this onboarding learning path for all new Mode users.
Get Started!
1 Course
Getting Started
Role-based
New Member
New Admin
New Analyst
New Business User

How to Create a Heat Map in Visual Explorer
Use Visual Explorer to bin data and create a heat map!
Get Started!
Visual Explorer
Intermediate
Analyst
Charts & Visualizations
Advanced
Quick Tips & Tricks

Flexible Data Labels in Visual Explorer
Add data labels and edit which values get them in a chart.
Get Started!
Visual Explorer
Analyst
Beginner
Charts & Visualizations

Histograms and Binned Data in Visual Explorer
Learn how to bin data for a field in any layer to create histograms and other visualizations.
Get Started!
Visual Explorer
Analyst
Charts & Visualizations

Scatter Plots in Visual Explorer
Use various mark types and colors to create a scatter plot.
Get Started!
Visual Explorer
Analyst
Charts & Visualizations

Dot Plots in Visual Explorer
See how a dot plot comes to life with mark types and layers.
Get Started!
Visual Explorer
Analyst
Charts & Visualizations

Interacting with Report Data
You can do more than just read a Report! Learn the basics of filters, parameters, and drilling down.
Get Started!
Business Insights
Beginner
Business User
Filters

Accessing the Visualization Builder
How to access Mode's visualization builder environment so you can start exploring your data using drag & drop analysis.
Get Started!
Analyst
Beginner
Business User
Charts & Visualizations
Explorations

Visual Explorer Basics
Start here to learn the fundamentals of Columns, Rows, Layers, and more!
Get Started!
Visual Explorer
Analyst
Beginner
Business User
Charts & Visualizations

Layers in Visual Explorer: Mark Type
Adjust mark type and settings with Layers to create different types of charts in Visual Explorer.
Get Started!
Visual Explorer
Analyst
Beginner
Charts & Visualizations

Layers in Visual Explorer: Color, Size, Text, Detail
Learn how to slice your data even further by adding color, size, text and detail with Layers in Visual Explorer.
Get Started!
Video
Visual Explorer
Intermediate
Analyst
Business User
Charts & Visualizations
Explorations

How Datasets Support Self-Serve Data Infrastructure
Learn how to strategically think about Datasets and the role they play in an effective self-serve analytics strategy.
Get Started!
Intermediate
Analyst
Admin
Datasets
What's new

Mode's Workflow
Acquaint yourself with what you can do with Mode.
Get Started!
Analyst
Beginner
Business User
Admin

App Menu Tour
Take a tour of the main menu in Mode.
Get Started!
Analyst
Beginner
Business User
Admin

Discover Page Tour
Check out helpful resources on the Discover page.
Get Started!
Analyst
Beginner
Business User
Admin

Using Mode's Search
Learn how to search for Reports, Datasets, and Collections.
Get Started!
Analyst
Beginner
Business User
Admin

Using Collections in Your Workspace
Develop a strategy for how your team organizes Reports and Datasets in Mode.
Get Started!
Organization
Admin

Connecting Databases
Learn how to easily and quickly connect a database to your Mode Workspace.
Get Started!
Permissions
Admin

Access Control & Permissions
This course sets you up to manage your teammates’ access to content in the Workspace, based on their roles in your organization.
Get Started!
Permissions
Admin

Setting Up Your Workspace
Learn how to create and manage your team’s Workspace in Mode.
Get Started!
Admin

Sign-In and Authentication Methods
Configure your team’s sign-in methods to streamline roles and permissions.
Get Started!
Permissions
Admin

Mode API Basics
Learn the fundamentals about Mode's API.
Get Started!
API
Advanced
Admin

Managing Schedules & Reports with Mode's API
See how to use Mode's API to programmatically manage schedules and Reports.
Get Started!
API
Scheduling & Sharing
Advanced
Admin

Use Cases for White-Label Embedding
Discover the basic use cases for embedding Mode Reports.
Get Started!
Intermediate
Admin

Implementing White-Label Embedding
Follow along step-by-step to embed your Mode Report into a website or application.
Get Started!
Advanced
Admin

Mode's API
Get started with Mode’s API and discover how to manage content and data usage with it.
Get Started!
Intermediate
API
Scheduling & Sharing
Advanced
Admin

Using Qualitative & Quantitative Data in Your Analysis
Learn about the different ways you can use qualitative and quantitive data in your drag & drop analysis.
Get Started!
Business Insights
Beginner
Business User
Charts & Visualizations
Interactive Course

Determining What Type of Chart to Create
This course provides a framework for deciding the best visualization to answer the business question at hand!
Get Started!
Business Insights
Analyst
Beginner
Business User
Charts & Visualizations
Interactive Course

Understanding the Data You Have to Work With
In this course you’ll learn how to interpret different field types in your data set so you are able to use them effectively in your analysis.
Get Started!
Business Insights
Beginner
Business User
Charts & Visualizations
Interactive Course
Intro to Drag & Drop Data Analysis
Learn how drag & drop analysis can help you examine, understand, identify patterns, and draw conclusions from your data.
Get Started!
Business Insights
Beginner
Business User
Charts & Visualizations

Answering Business Questions in Mode
This learning path contains courses covering no-code workflows for getting answers to your business questions using data in Mode.
Get Started!
3 Courses
Strategic Accounts
Role-based

How to Create a Report Schedule
You can schedule data refreshes and automatically send Reports to your teammates.
Get Started!
Creating Reports
Analyst
Beginner
Business User
Scheduling & Sharing
Admin

Managing Datasets with Mode's API
See how to use Mode's API to programmatically manage schedules and Reports.
Get Started!
API
Advanced
Admin
Datasets

Code-Free Self Service Basics
Learn the basics of viewing and sharing Reports in Mode so you can monitor KPIs.
Get Started!
Beginner
Business User
New Business User

Managing Sharing & Embedding Settings
Help your team’s Reports reach the right people at the right times.
Get Started!
Permissions
Admin

Best Practices for Migrating to Mode
Prepare for a seamless transition to Mode.
Get Started!
Beginner
Admin

How to Rebuild and Optimize Your Data Workflow in Mode
As you ramp up with the product, leverage Mode features to make your analytics work more efficient.
Get Started!
Data Usage
Beginner
Admin

Best Practices for White-Label Embedding
Follow these tips to optimize your embedded Reports.
Get Started!
Intermediate
Advanced
Admin

Mode Administration Certificate Path
This certificate path covers everything a Mode admin needs to know.
Get Started!
10 Courses
Getting Started
Admin
Role-based

Migrating to Mode
If you’re moving your team and existing workflow from another analytics tool to Mode, there are a few key considerations to guide the transition.
Get Started!
Beginner
Admin

How to Share a Report
You can send out Report via direct link, Slack, or email.
Get Started!
Creating Reports
Analyst
Beginner
Business User
Scheduling & Sharing
Admin

Building Datasets for Self-Serve Analytics
Learn how to build Datasets that enable self-service by applying technical, usability and discoverability best practices.
Get Started!
Intermediate
Analyst
Admin
Datasets
What's new

Optimizing Workspace Data Usage
Discover how to leverage Mode features to keep down data usage.
Get Started!
Permissions
Data Usage
Admin

White-Label Embedding
Learn about Mode’s embedded analytics option and how best to implement it for your Workspace.
Get Started!
Intermediate
Beginner
Scheduling & Sharing
Advanced
Admin

Managing Data Compute
Data usage is a big deal in Mode – get out in front of it.
Get Started!
Data Usage
API
Advanced
Admin

Best Practices for Monitoring Data Compute
Find out how to monitor your team's data usage in Mode.
Get Started!
Data Usage
Admin
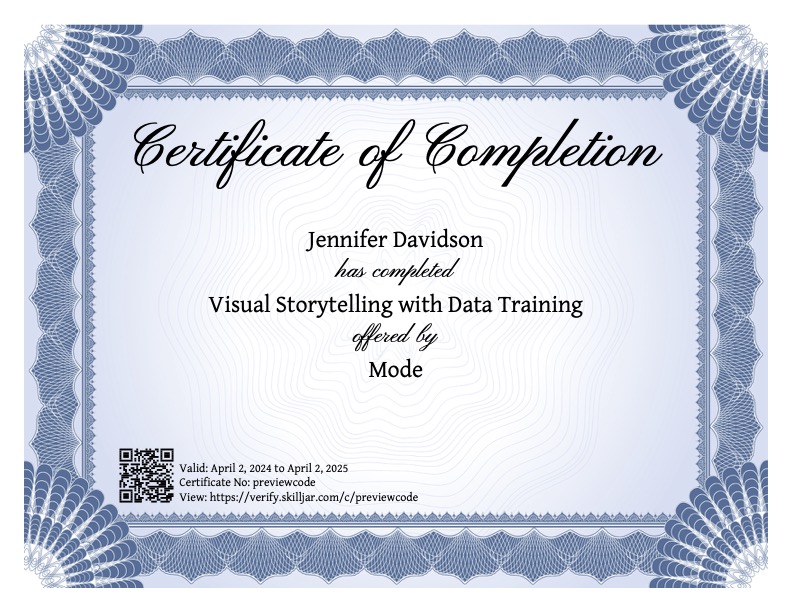
Visual Storytelling with Data Certificate of Completion
After completing all courses in the Visual Storytelling with Data Certificate Path, you'll be eligible to accept your Mode Visual Storytelling with Data Certificate of Completion!
Get Started!

Data Wrangling Certificate of Completion
After completing all courses in the Data Wrangling Certificate Path, you'll be eligible to accept your Mode Data Wrangling Certificate of Completion!
Get Started!

Mode Administration Certificate of Completion
After completing all courses in the Mode Administration Certificate Path, you'll be eligible to accept your Mode Administration Certificate of Completion!
Get Started!

Code-Free Self Service Certificate of Completion
After completing all courses in the Code-Free Self Service Certificate Path, you'll be eligible to accept your Mode Code-Free Self Service Certificate of Completion!
Get Started!
Visual Storytelling with Data Certificate of Completion
After completing all courses in the Visual Storytelling with Data Certificate Path, you'll be eligible to accept your Mode Visual Storytelling with Data Certificate of Completion!
Get Started!
Using Visual Explorer to Create Dynamic Visualizations
Leverage Visual Explorer’s features to easily add depth and clarity to your visualizations.
Get Started!
Visual Explorer
Intermediate
Analyst
Beginner
Charts & Visualizations
Custom Colors
Advanced
Calculations
Mode's Visualization Environments
Discover Quick Charts and Visual Explorer, and determine where to start building your visualizations.
Get Started!
Visual Explorer
Analyst
Beginner
Charts & Visualizations
Adding Filters and Parameters to Reports
Determine when and how to add filters and parameters to maximize a Report’s impact.
Get Started!
Data Usage
Creating Reports
Analyst
Business User
Report Styling & Presentation
Create Reports that effectively convey information in a clear and compelling way.
Get Started!
Creating Reports
Analyst
Beginner
Business User
Data Storytelling
Visual Explorer Basics
Start here to learn the fundamentals of Columns, Rows, Layers, and more!
Get Started!
Visual Explorer
Analyst
Beginner
Business User
Charts & Visualizations
Creating Various Types of Quick Charts
Learn how to create some of the most common types of data visualizations in Mode!
Get Started!
Analyst
Beginner
Business User
Charts & Visualizations
Interactive Course
Ways to Build BI Content in Mode
Mode offers multiple ways to build BI content to drive your business forward.
Get Started!
Creating Reports
Analyst
Beginner
Building Datasets for Self-Serve Analytics
Learn how to build Datasets that enable self-service by applying technical, usability and discoverability best practices.
Get Started!
Intermediate
Analyst
Admin
Datasets
What's new
Data Wrangling Certificate of Completion
After completing all courses in the Data Wrangling Certificate Path, you'll be eligible to accept your Mode Data Wrangling Certificate of Completion!
Get Started!
Querying Data in Mode
Leverage Mode’s powerful SQL editor to query your data sources.
Get Started!
SQL
Analyst
Data Engineer
Using the Notebook for Python & R Analysis
Get to know Mode’s Notebook environment so that you can execute advanced analysis on top of query results.
Get Started!
Intermediate
Analyst
Notebooks
Beginner
Data Engineer
Familiarizing Yourself with Mode
New to Mode? Start here and prepare to do your best analytics work yet.
Get Started!
Analyst
Beginner
Business User
Admin
New Member
New Admin
New Analyst
New Business User
How Datasets Support Self-Serve Data Infrastructure
Learn how to strategically think about Datasets and the role they play in an effective self-serve analytics strategy.
Get Started!
Intermediate
Analyst
Admin
Datasets
What's new
Building Datasets for Self-Serve Analytics
Learn how to build Datasets that enable self-service by applying technical, usability and discoverability best practices.
Get Started!
Intermediate
Analyst
Admin
Datasets
What's new
Launching Datasets to Your Organization
Learn how to plan a successful Datasets launch to your teams, including stakeholder enablement and how to keep Datasets updated over time.
Get Started!
Analyst
Admin
Datasets
What's new
Determining What Type of Chart to Create
This course provides a framework for deciding the best visualization to answer the business question at hand!
Get Started!
Business Insights
Analyst
Beginner
Business User
Charts & Visualizations
Interactive Course
Creating Various Types of Quick Charts
Learn how to create some of the most common types of data visualizations in Mode!
Get Started!
Analyst
Beginner
Business User
Charts & Visualizations
Interactive Course
Intro to Drag & Drop Data Analysis
Learn how drag & drop analysis can help you examine, understand, identify patterns, and draw conclusions from your data.
Get Started!
Business Insights
Beginner
Business User
Charts & Visualizations
Understanding the Data You Have to Work With
In this course you’ll learn how to interpret different field types in your data set so you are able to use them effectively in your analysis.
Get Started!
Business Insights
Beginner
Business User
Charts & Visualizations
Interactive Course
Using Qualitative & Quantitative Data in Your Analysis
Learn about the different ways you can use qualitative and quantitive data in your drag & drop analysis.
Get Started!
Business Insights
Beginner
Business User
Charts & Visualizations
Interactive Course
Getting Insights from Mode Reports
Take this course to find out how Mode can help you leverage data to make data-driven business decisions!
Get Started!
Business Insights
Analyst
Beginner
Interactive Course
Workflow
Getting Started with Calculated Fields
This course will cover how to use calculated fields to improve your workflow, extend your analysis, and get faster insights with your data.
Get Started!
SQL
Intermediate
Analyst
Business User
Interactive Course
Workflow
Using Custom Colors in Mode
Color is an important tool for communicating insights through data visualizations, and it's great to stay on-brand, too!
Get Started!
Intermediate
Analyst
Business User
Charts & Visualizations
Custom Colors
Interactive Course
Admin
What's new
Using Collections in Your Workspace
Develop a strategy for how your team organizes Reports and Datasets in Mode.
Get Started!
Organization
Admin
Connecting Databases
Learn how to easily and quickly connect a database to your Mode Workspace.
Get Started!
Permissions
Admin
Managing Data Compute
Data usage is a big deal in Mode – get out in front of it.
Get Started!
Data Usage
API
Advanced
Admin
Migrating to Mode
If you’re moving your team and existing workflow from another analytics tool to Mode, there are a few key considerations to guide the transition.
Get Started!
Beginner
Admin
Mode Administration Certificate of Completion
After completing all courses in the Mode Administration Certificate Path, you'll be eligible to accept your Mode Administration Certificate of Completion!
Get Started!
Managing Sharing & Embedding Settings
Help your team’s Reports reach the right people at the right times.
Get Started!
Permissions
Admin
Access Control & Permissions
This course sets you up to manage your teammates’ access to content in the Workspace, based on their roles in your organization.
Get Started!
Permissions
Admin
Sign-In and Authentication Methods
Configure your team’s sign-in methods to streamline roles and permissions.
Get Started!
Permissions
Admin
Setting Up Your Workspace
Learn how to create and manage your team’s Workspace in Mode.
Get Started!
Admin
How Datasets Support Self-Serve Data Infrastructure
Learn how to strategically think about Datasets and the role they play in an effective self-serve analytics strategy.
Get Started!
Intermediate
Analyst
Admin
Datasets
What's new
Exercise 7: Geo Mapping (Option 2 - JavaScript)
After completing this exercise you will have an understanding of how to use Mode's HTML editor and how to use JavaScript to complement Mode's native visualizations.
Get Started!
Analyst
Notebooks
Charts & Visualizations
Data Engineer
Advanced
Exercise
Exercise 8: Adding a Report Parameter and Creating a Gauge Visualization
After completing this exercise you will have an understanding of how to add parameters to a report.
Get Started!
Analyst
Notebooks
Data Engineer
Advanced
Exercise
Exercise 4: Creating Hypotheses Through Visual Analytics
After completing this exercise you will have an understanding of how to use Mode's visualization environment to create hypotheses and gain deeper insights.
Get Started!
Visual Explorer
Charts & Visualizations
Data Storytelling
Exercise
Filters
Exercise 1: From SQL Query to Simple Report
After completing this exercise you will have an understanding of how to navigate the Mode interface to go from SQL query to a simple report.
Get Started!
SQL
Creating Reports
Charts & Visualizations
Exercise
Exercise 3: Using Table Calculations and Calculated Fields
After completing this exercise you will have an understanding of how to create calculated fields in Mode and apply custom conditional formatting.
Get Started!
Analyst
Custom Colors
Calculations
Exercise
Exercise 2: Simple Visual Explorer Chart and Custom Colors
After completing this exercise you will have an understanding of how to use Mode's Visual Explorer to create simple visualizations.
Get Started!
Visual Explorer
Charts & Visualizations
Custom Colors
Exercise
Exercise 10: Creating & Using a Dataset
After completing this exercise you will have an understanding of how to create a new Dataset in Mode, and how to use a Dataset for a no-code report creation process.
Get Started!
Analyst
Business User
Datasets
Exercise
Exercise 5: Predictive Analytics Using Python
After completing this exercise you will have an understanding of how to use Mode's integrating notebook to perform Python-based analytics.
Get Started!
Analyst
Notebooks
Charts & Visualizations
Data Engineer
Advanced
Exercise
Exercise 6: Geo Mapping (Option 1 - Python)
After completing this exercise you will have an understanding of how to use libraries in Python to create visualizations to complement Mode's native capabilities.
Get Started!
Analyst
Notebooks
Charts & Visualizations
Data Engineer
Advanced
Exercise
Exercise 9: Adding Filters, Text and Formatting a Report
After completing this exercise you will have an understanding of how to apply Report filters, add text and format a Report.
Get Started!
Business Insights
Creating Reports
Analyst
Business User
Explorations
Filters
Code-Free Self Service Certificate of Completion
After completing all courses in the Code-Free Self Service Certificate Path, you'll be eligible to accept your Mode Code-Free Self Service Certificate of Completion!
Get Started!
Using Code-Free Workflows to Get Insights
Take a step farther into using Mode and learn to interact with Report data and create your own visualizations.
Get Started!
Video Library
Intermediate
Business User
New Business User
Code-Free Self Service Basics
Learn the basics of viewing and sharing Reports in Mode so you can monitor KPIs.
Get Started!
Beginner
Business User
New Business User
Visual Storytelling with Data Certificate of Completion
After completing all courses in the Visual Storytelling with Data Certificate Path, you'll be eligible to accept your Mode Visual Storytelling with Data Certificate of Completion!
Get Started!
Data Wrangling Certificate of Completion
After completing all courses in the Data Wrangling Certificate Path, you'll be eligible to accept your Mode Data Wrangling Certificate of Completion!
Get Started!
Mode Administration Certificate of Completion
After completing all courses in the Mode Administration Certificate Path, you'll be eligible to accept your Mode Administration Certificate of Completion!
Get Started!
Code-Free Self Service Certificate of Completion
After completing all courses in the Code-Free Self Service Certificate Path, you'll be eligible to accept your Mode Code-Free Self Service Certificate of Completion!
Get Started!